
For years, weather-monitoring agencies around the globe have collected data to help determine whether and how tropical cyclones — called hurricanes in the US — change over time.
But another thing that changes over time is the technology used to record storm data. This, combined with changes in record keeping standards has created an inconsistent dataset that is difficult to analyze collectively. Climatologists are left with two options: limit their research to a subset of the data and risk of a less representative analysis, or reorganize the data into a consistent format, a time- consuming task.
Cyclone Center, a collaboration between academic, non-profit and government organizations, is enlisting citizen scientists to attempt the latter. Through its website, volunteers are helping Although image classification is a common task in crowdsourced projects across multiple science fields, Cyclone Center is the first project to tackle such a massive meteorological dataset.
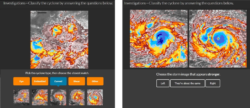
Recently I tried Cyclone Center myself. In the task, volunteers classify images by cyclone type and intensity. For guidance, Cyclone Center provides a step-by-step tutorial and reference guides including reference images. While I worried that the subjective nature of some of my categorization might confound their data, a conversation with the Cyclone Center research team allayed my concerns.
Extracting reliable information
“Getting the ‘right’ answer each time isn’t possible,” said Ken Knapp, meteorologist at the NOAA Center for Weather and Climate in Asheville, N.C. and a member of Cyclone Center’s scientific team. “Classifiers have to get used to guessing and not knowing the right answer,” he said. By appropriately processing the data, the team can extract reliable information from these guesses. Their recent paper in the American Meteorological Society journal Monthly Weather Review describes their methodology. I summarize it briefly here.
The Cyclone Center team developed an algorithm that aggregates classifications from multiple volunteers while accounting for biases in how each individual analyzes an image. For example, if ‘Tom’ tends to classify storms as weaker, relative to other volunteers, all his classifications will be adjusted accordingly. Then for each image, each volunteer’s bias-adjusted classifications is combined to reach a consensus for that image.
The team showed that storm classification using their bias-corrected consensus algorithm strongly agreed with classifications made by a professional or a computer. In fact, the consensus analysis was better than a computer at detecting the subtle changes as storms transition from weaker to stronger systems.
A surprise was how little input was sufficient to reach a reliable consensus. “We were encouraged that 10 classifications per image was a reasonable number to get good agreement using our algorithm,” said Christopher Hennon, associate professor of atmospheric sciences at the University of North Carolina-Asheville and a coauthor of the paper. “Having such a low requirement for usefulness has helped us to lower the number of classifications required to finish the data.”
Implications for the future
Currently, Cyclone Center is wrapping up analysis of all storm data from 2005. Having a year’s worth of reanalyzed data will provide a basis against which storms from other years can be analyzed. “Moving forward, we would like to focus on analyzing all storm data from the Western Pacific basin. This is the most active basin, and if there are changes in that basin, it can affect storm activity globally,” said Knapp.
The success of this project has broader implications Hennon explained. “Our methodology for collecting and providing access to data through an online portal could serve as a model for how other meteorological reanalysis projects might work. And our methodology for data analysis could inform subsequent projects on how to handle multiple opinions to achieve convergence on a reasonable answer.”
Curious? Try your hand at analyzing cyclones, and don’t worry if you need to make a few guesses.